


IT service desk metrics are indicators that track the performance and effectiveness of a service desk. By examining these metrics, you can gain insights into areas of strength and identify potential bottlenecks or inefficiency within your service desk. But what are these IT service desk metrics? In this article, we'll explore different metrics that will help improve your service desk's operations.
But why is it important to track IT service desk metrics? What value will it bring to your organization? Tracking IT service metrics is essential for keeping your IT operations efficient. This blog post will discuss the top 12 IT service desk metrics in detail. But first, let's understand the metrics' importance.
Importance of Tracking IT Service Desk Metrics
Here, we will discuss the importance of tracking key IT service desk metrics.
- Make Better Service Desk Decisions: IT service desk metrics provide a clear picture of your service desk's performance. Tracking data, such as ticket volume, response times, etc., helps you make better decisions. Whether it's adjusting user access levels or optimizing processes, data-driven choices lead to better service and efficiency.
- Reduce Your Support Costs: Tracking IT service desk metrics helps your support team identify inefficiencies. This could be a costly affair for your organization. If certain issues take too long to resolve or there are unnecessary escalations, you can address these problems. It is done by improving workflows and minimizing repetitive tasks. This saves time and reduces the overall cost of support.
- Create Better Support Documentation and Workflows: When your team tracks IT service desk metrics, you can see patterns in the types of issues that arise. This allows them to create more effective support documentation and workflows. With clear processes and helpful guides in place, your team can resolve common problems faster, reducing the need for escalations and boosting productivity.
- Cut Down on Support Resolution Times: Tracking IT service desk metrics can significantly reduce support resolution times. By monitoring how long it takes to resolve tickets, you can identify bottlenecks and areas for improvement. Quicker resolutions keep users satisfied and reduce pressure on your team.
- Enable Employees with Better IT Support: Your employees feel more empowered when you provide better IT support through optimized workflows and faster response times. They can trust that their tech problems will be handled quickly, allowing them to stay productive and focused. In the long run, this boosts the performance of your entire organization.
Now that you know why tracking metrics is important, let's explore the key IT service desk metrics one by one.
12 Must Track IT Service Desk Metrics
Below are 12 key IT service desk metrics that you need to keep track of in order to effectively deliver IT services:

1. Incoming Ticket Volume
Let's consider, there’s a sudden increase in your incoming ticket volume. It might overwhelm your team, leading to slower response time and decreased service quality.
On the other hand, what if the volume of incoming service requests is low? Low volume might be an opportunity to focus on proactive improvements, such as system upgrades or training.
Therefore, tracking this metric helps you identify if specific times of the day, week, or month generate more requests. This allows you to schedule your team members' workload accordingly.
How to Measure Your Incoming Ticket Volume?
Measuring incoming ticket volume is simple. You can count the number of tickets submitted during a specific period of time. Depending on the nature of your service desk, this could be measured daily, weekly, monthly, quarterly, or annually. You may also want to break down the volume by categories, such as incident requests, service requests, etc.
2. First Contact Resolution (FCR)
Suppose your employees get their issues solved on the very first contact with your team. This will save your team's time. This is what first-contact resolution (FCR) means.
A high FCR means fewer tickets re-opened or escalated, reducing your team's workload. On the other hand, a low FCR means knowledge gaps in your team. It might also indicate underlying issues with processes, tools, or systems that need attention.
A high FCR rate helps your team become more efficient. It means fewer back-and-forth interactions. This saves time for both your support team and employees. Further, when you solve problems quickly, employees can return to work faster. This improves productivity across your organization.
How to Calculate First Contact Resolution Rate?
To measure FCR, divide the number of issues resolved on the first interaction by the total number of support requests handled within a certain time frame. For accuracy, it's important to define "resolved" as the problem being completely fixed.
Here’s the formula:
FCR % = (Tickets Resolved on First Contact / Total Tickets Handled) × 100
Example Calculation:
Let’s say your service desk received 400 support requests in a month. Out of 400, 320 of them were resolved on the first contact. Using the formula:
FCR % = (320 / 400) × 100 = 80%
This means your team successfully resolved 80% of tickets on the first contact. A high first contact resolution rate like this indicates that your service desk is running efficiently
3. Ticket Backlogs
Ticket backlogs refer to the number of unresolved tickets. Tracking this IT service desk metrics assists you in understanding your team's workload and the efficiency of your support process.
Moreover, this IT services desk metric helps you quickly identify when your team is falling behind. This allows you to take action before the backlog increases, ensuring that issues are resolved in a timely manner and employees stay satisfied.
If your ticket backlogs increase, resolving issues can lead to delays. This might frustrate employees and affect your business operations.
How to calculate your ticket backlogs?
To calculate the ticket backlog, here's the formula:
Ticket Backlogs = No. of open tickets - No. of closed tickets
This can be done for a specific period of time.
Consider you have 80 open tickets at the start of the month and 66 closed tickets by the end. This means your ticket backlog would be 14.
4. Average Handle Time
Average handle time (AHT) refers to the total time taken to resolve a ticket. It starts when the ticket is opened and ends when it's closed. Tracking the IT service desk metrics is important because it directly impacts user satisfaction and service desk productivity. Knowing how long it takes to handle requests enables you to identify areas for improvement and optimize your team's performance.
A lower AHT often means faster resolutions, which leads to happier employees and smoother operations. On the other hand, a high AHT could indicate inefficiencies in your process. Monitoring this metric will help you take the correct steps, which will improve both the speed and quality of your service.
How to Measure Average Handle Time?
Measuring AHT is simple. It’s calculated by dividing the total time spent on all tickets by the number of tickets handled. The formula is:
AHT=Total Handle Time/Number of Tickets
For instance, let’s say your team handled 100 tickets in a day. The total time spent on these tickets is 500 minutes. The AHT would be:
AHT=500 minutes/100 tickets=5 minutes per ticket
This means, on average, your team spends 5 minutes handling each ticket.
5. Support Tickets Opened Vs. Closed
This IT service desk metric highlights the balance between user needs and your team's ability to resolve issues. A consistent gap between opened and closed tickets might mean users face delays in solving their problems, which leads to reduced productivity.
Thus, tracking this helps you identify patterns early and take action. It allows you to identify trends like recurring issues or times when your team struggles to keep up. Addressing these can improve service desk efficiency and user satisfaction. It can also help you allocate resources more efficiently.
How to Calculate the Ratio of Tickets Opened vs. Closed
To calculate the ratio, you can simply compare the total number of tickets opened during a specific period to those that were resolved or closed during the same period.
Formula:
Closed Tickets % = (Closed Tickets / Opened Tickets) × 100
For example, if 106 tickets were opened and 85 were closed in one week, your service desk closed 80.1% of the opened tickets.
6. Service Level Agreement Compliance
Service level agreement (SLA) refers to whether your IT service desk meets the resolution times agreed upon in SLAs with the employees. If SLAs are not met, it can lead to operational disruptions.
Monitoring the essential IT service desk metrics helps ensure your team stays on track and meets expectations. In addition, tracking SLA compliance allows you to assess service desk performance. Over time, you can adjust your SLAs to better align with your team’s capabilities and your organization's needs.
How to Calculate SLA Compliance
To measure this, you can calculate the percentage of tickets resolved within the agreed time frame versus the total number of tickets. The formula is:
SLA Compliance=Number of Tickets Resolved Within SLA/Total Number of Tickets×100
Now, imagine your team handled 200 tickets in a month. 180 of them were resolved within the SLA terms. The SLA compliance would be:
SLA Compliance=180/200×100=90%
This means your team met SLA requirements 90% of the time.
7. Time to Resolution
Time to resolution (TTR) measures how long it takes to resolve a ticket from when it is opened to when it is closed. Tracking TTR reflects the efficiency of your team. Faster resolution times often lead to higher user satisfaction.
When users get quick solutions to their problems, they can return to work without much disruption. This improves overall productivity in the organization.
Additionally, analyzing your ticket resolution rate can highlight patterns in service requests. For instance, if many tickets are related to a specific software, it might be time to review that software's training or support materials.
To measure TTR, you need to collect data from your ticketing system. For this, you can note the time when a ticket is opened. Then, record the time it is resolved. The formula for calculating TTR is simple:
Time to Resolution = Time of Resolution - Time of Ticket Creation
For example, a ticket is created at 10:00 AM and resolved at 11:30 AM. The TTR would be 1 and half hour. This calculation gives you valuable insights into how well your team is performing.
8. Escalation Rate
The escalation rate shows how often a ticket is passed from the first level of support to a higher level. When you track escalation rates, you can better distribute workloads. Also, it improves your team's performance. It allows you to identify patterns and resolve bottlenecks.
A high escalation rate might indicate that your support team lacks the knowledge or tools to solve issues efficiently. This can lead to delays and a higher workload for your senior authority. On the contrary, fewer escalations mean timely resolutions, which leads to smoother operations.
How to Measure Escalation Rate?
To measure the escalation rate, you need to calculate the percentage of tickets escalated compared to the total number of tickets handled. The formula is:
Escalation Rate (%) = (Number of escalated tickets / Total number of tickets) × 100
Imagine your service desk handles 650 tickets in a month and escalates 65 of them. Your escalation rate would be:
Escalation Rate = (65 / 650) × 100 = 10%
A 10% escalation rate means - 1 in 10 tickets need extra help from higher-level support.
9. User Satisfaction Rate
This IT service desk metrics reflects how your users feel about the support they receive. It allows you to understand how effective your service desk is. This can lead to better support processes and improved services.
When satisfied, users are more productive and less likely to leave your organization, which leads to lower turnover.
You can use surveys to measure user satisfaction. After resolving a ticket, start with a simple questionnaire. Ask questions like, "How satisfied are you with the response time?" or "Was your issue resolved on the first contact?" You can use a scale from 1 to 5, where 1 is very dissatisfied, and 5 is very satisfied.
Here’s an example of how to calculate the user satisfaction rate. Suppose you receive 100 survey responses after resolving tickets. Out of these, 75 respondents gave a score of 4 or 5. To find the levels of satisfaction rate, you divide the number of satisfied responses (75) by the total responses (100). Then multiply by 100.
So, the calculation is:
Satisfaction Rate=(75/100)×100=75%
10. Cost per Ticket
Cost per ticket measures the average expense incurred to resolve a ticket. Tracking this IT service desk metric provides insights into your support team's efficiency. This information helps you allocate resources wisely and make data-driven decisions.
To measure the cost per ticket, follow the below-mentioned formula.
Cost per Ticket = Total Operational Costs/Total Tickets Resolved
Let’s say your IT service desk has total operational costs of $50,000 over a month. During that month, the team resolves 1,000 tickets. To calculate the cost per ticket, use the following formula:
Cost per Ticket=50,000/1,000=50
In this example, the cost per ticket is $50. This means it costs the organization $50 to resolve each support ticket.
11. Incident Severity
Incident severity categorizes incidents based on their impact and urgency. Tracking this metric helps your team prioritize responses. When you know the severity of an incident, you can allocate resources effectively and ensure that critical issues are addressed first. This leads to faster resolutions and minimizes downtime.
Monitoring incident severity also helps improve service quality. By analyzing the data, you can identify patterns and recurring issues. This information allows your service desk team to take appropriate measures.
Moreover, you can invest in better training, tools, or processes to prevent high-severity incidents from happening again, which will improve overall user satisfaction.
To measure incident severity, you can use a simple classification system. Incidents are commonly divided into categories such as low, medium, high, and critical. Each category reflects the urgency and impact on business operations.
For example, a low-severity incident may involve minor issues that don’t disrupt workflow. In contrast, a critical incident could involve a system failure affecting multiple users.
12. Agent Utilization Rate
AUR measures how effectively your service desk agents/team members use their time. Tracking this rate helps you understand their productivity levels. A higher utilization rate often means that agents are working efficiently. This leads to quicker response times and improved service quality for users. On the contrary, if the utilization rate is too low, it may indicate that agents are underworked.
How to calculate AUR?
To measure agent utilization rate, follow a simple formula.
Agent Utilization Rate = (Total Productive Time/Total Available Time)×100
Now, let’s say your IT service desk has three agents. Each agent is available for 40 hours a week, giving a total available time of 120 hours (3 agents x 40 hours). If the agents spend a combined total of 80 hours on productive tasks, the utilization rate would be calculated as follows:
Agent Utilization Rate=(80 hours/120 hours)×100=66.67%
In this example, the agent utilization rate is 66.67%. This means that approximately two-thirds of the agents' available time is spent on productive tasks.
Tracking these IT service metrics will help you understand how well your current service desk functions. However, if it cannot serve its intended purpose or meet your expectations, you can consider opting for a request management solution like Zluri.
Zluri’s app catalog and access request solution will help streamline your service delivery with ease. Let’s quickly go through how it does that.
Improve The Effectiveness Of Your Service Delivery with Zluri
Zluri's app catalog and access request solution automates the entire access request management process. It allows your team to create workflows that help effectively manage multiple access requests with just a few clicks.
Your team no longer has to practice manual access request management methods, which are time-consuming and prone to errors.
Although automation stands as a primary advantage of having a solution like Zluri, it offers more than just automation to streamline your service delivery. Here are the other benefits:
- Visibility Into Your Access Requests
It provides your team with complete visibility into incoming requests, pending requests, and approved requests.
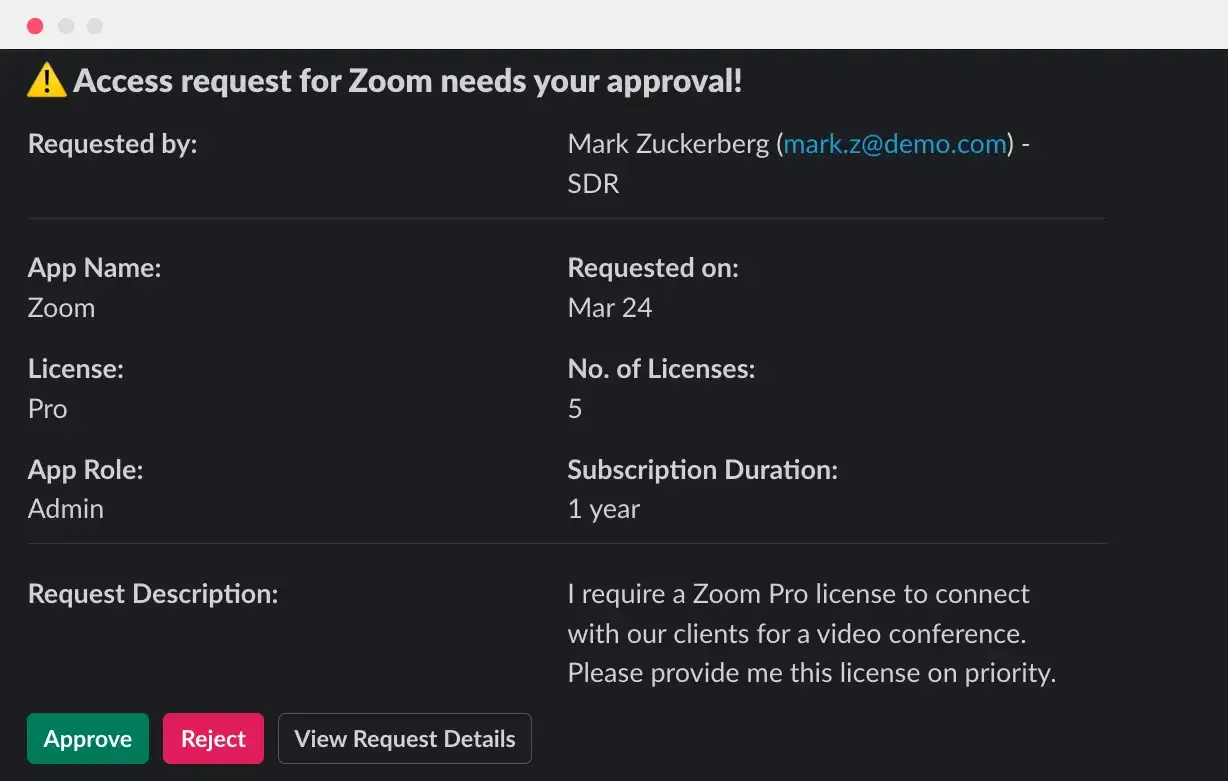
The image below shows how approvers receive automatic notifications via Slack for incoming requests.
The image below shows the pending requests.
The image below shows the approved requests or completed requests.
With this visibility, they can effectively manage, organize, and prioritize requests. This speeds up the approval process and saves them significant time.
- Integrates With Slack To Provide Timely Alerts
Zluri integrates with Slack, providing your team with instant notifications for access requests in real-time. Therefore, whenever an employee submits a request, your teams receive notifications via Slack.
The image below shows how Zluri enables access requests through Slack
Furthermore, the app access request details (who has requested for what apps and for how long) appear in the IT team's Slack channel and Zluri's access request dashboard under pending requests.
- Detailed View Of Access Requests
Additionally, as per Kuppingercole's research and analysis report, to provide your team with a more detailed view, Zluri's access request management categorizes requests into two subsections: pending and completed.
In the pending section, your team can easily identify which applications are awaiting approval, while the completed section displays all approved requests.
This way, your team doesn't have to go back and forth through different screens to determine which requests are pending and which are completed, saving time and improving efficiency. Also, this minimizes the chances of missing out on approving requests.
Additionally, audit trails allow for tracking of actions taken, providing visibility into all details.
- Automated Request Approval Triggers
Your team can create triggers (when and then conditions) to automate request approval actions. For instance, your team can set automated rules for when a new employee from the marketing department joins the organization and grants them access to Salesforce.
What are you waiting for? Book a demo now to witness how Zluri's advanced capabilities simplify your service management process.
Frequently Asked Questions (FAQs)
1. What is the difference between IT service desk metrics and KPIs?
IT service desk metrics are the basic data that measure different aspects of your service desk. Key performance indicators (KPIs), on the other hand, are broader performance indicators that use this data to give a larger picture of how the service desk is performing. It helps you see if your ITSM goals are being achieved and if they align with your business goals.
2. What is the average resolution time?
Average resolution time refers to the average amount of time it takes for your support agents to resolve all open tickets within a specific time period.
3. What is the customer satisfaction score?
Customer satisfaction score is a widely used help desk metric. It shows how happy customers are with a company's products or services. It is measured through customer feedback and represented as a percentage. Here, 100% indicates completely satisfied customers, and 0% reflects extreme dissatisfaction.
4. What are customer satisfaction surveys?
A customer satisfaction survey is a solution businesses use to collect customer feedback about their experience. These surveys usually ask customers to rate their satisfaction with a product, service, or recent interaction.
5. How do you calculate an average ticket volume?
To calculate average ticket volume, first find the total sales amount and the number of transactions. Then, divide the total sales by the number of transactions to get the average ticket size.

.svg)